


USDCNH seems to be forming a double zigzag of the cycle degree w-x-y.
The first large wave w is completed as a standard zigzag. The bearish intervening wave x could also be fully constructed. At the moment it looks completed as a double zigzag of the primary degree Ⓦ-Ⓧ-Ⓨ.
In the near future, prices could move higher in the actionary wave y. Perhaps it will take the form of a standard zigzag Ⓐ-Ⓑ-Ⓒ.
Most likely, we will see the end of the first primary wave Ⓐ at the maximum of 7.00, or a little higher.
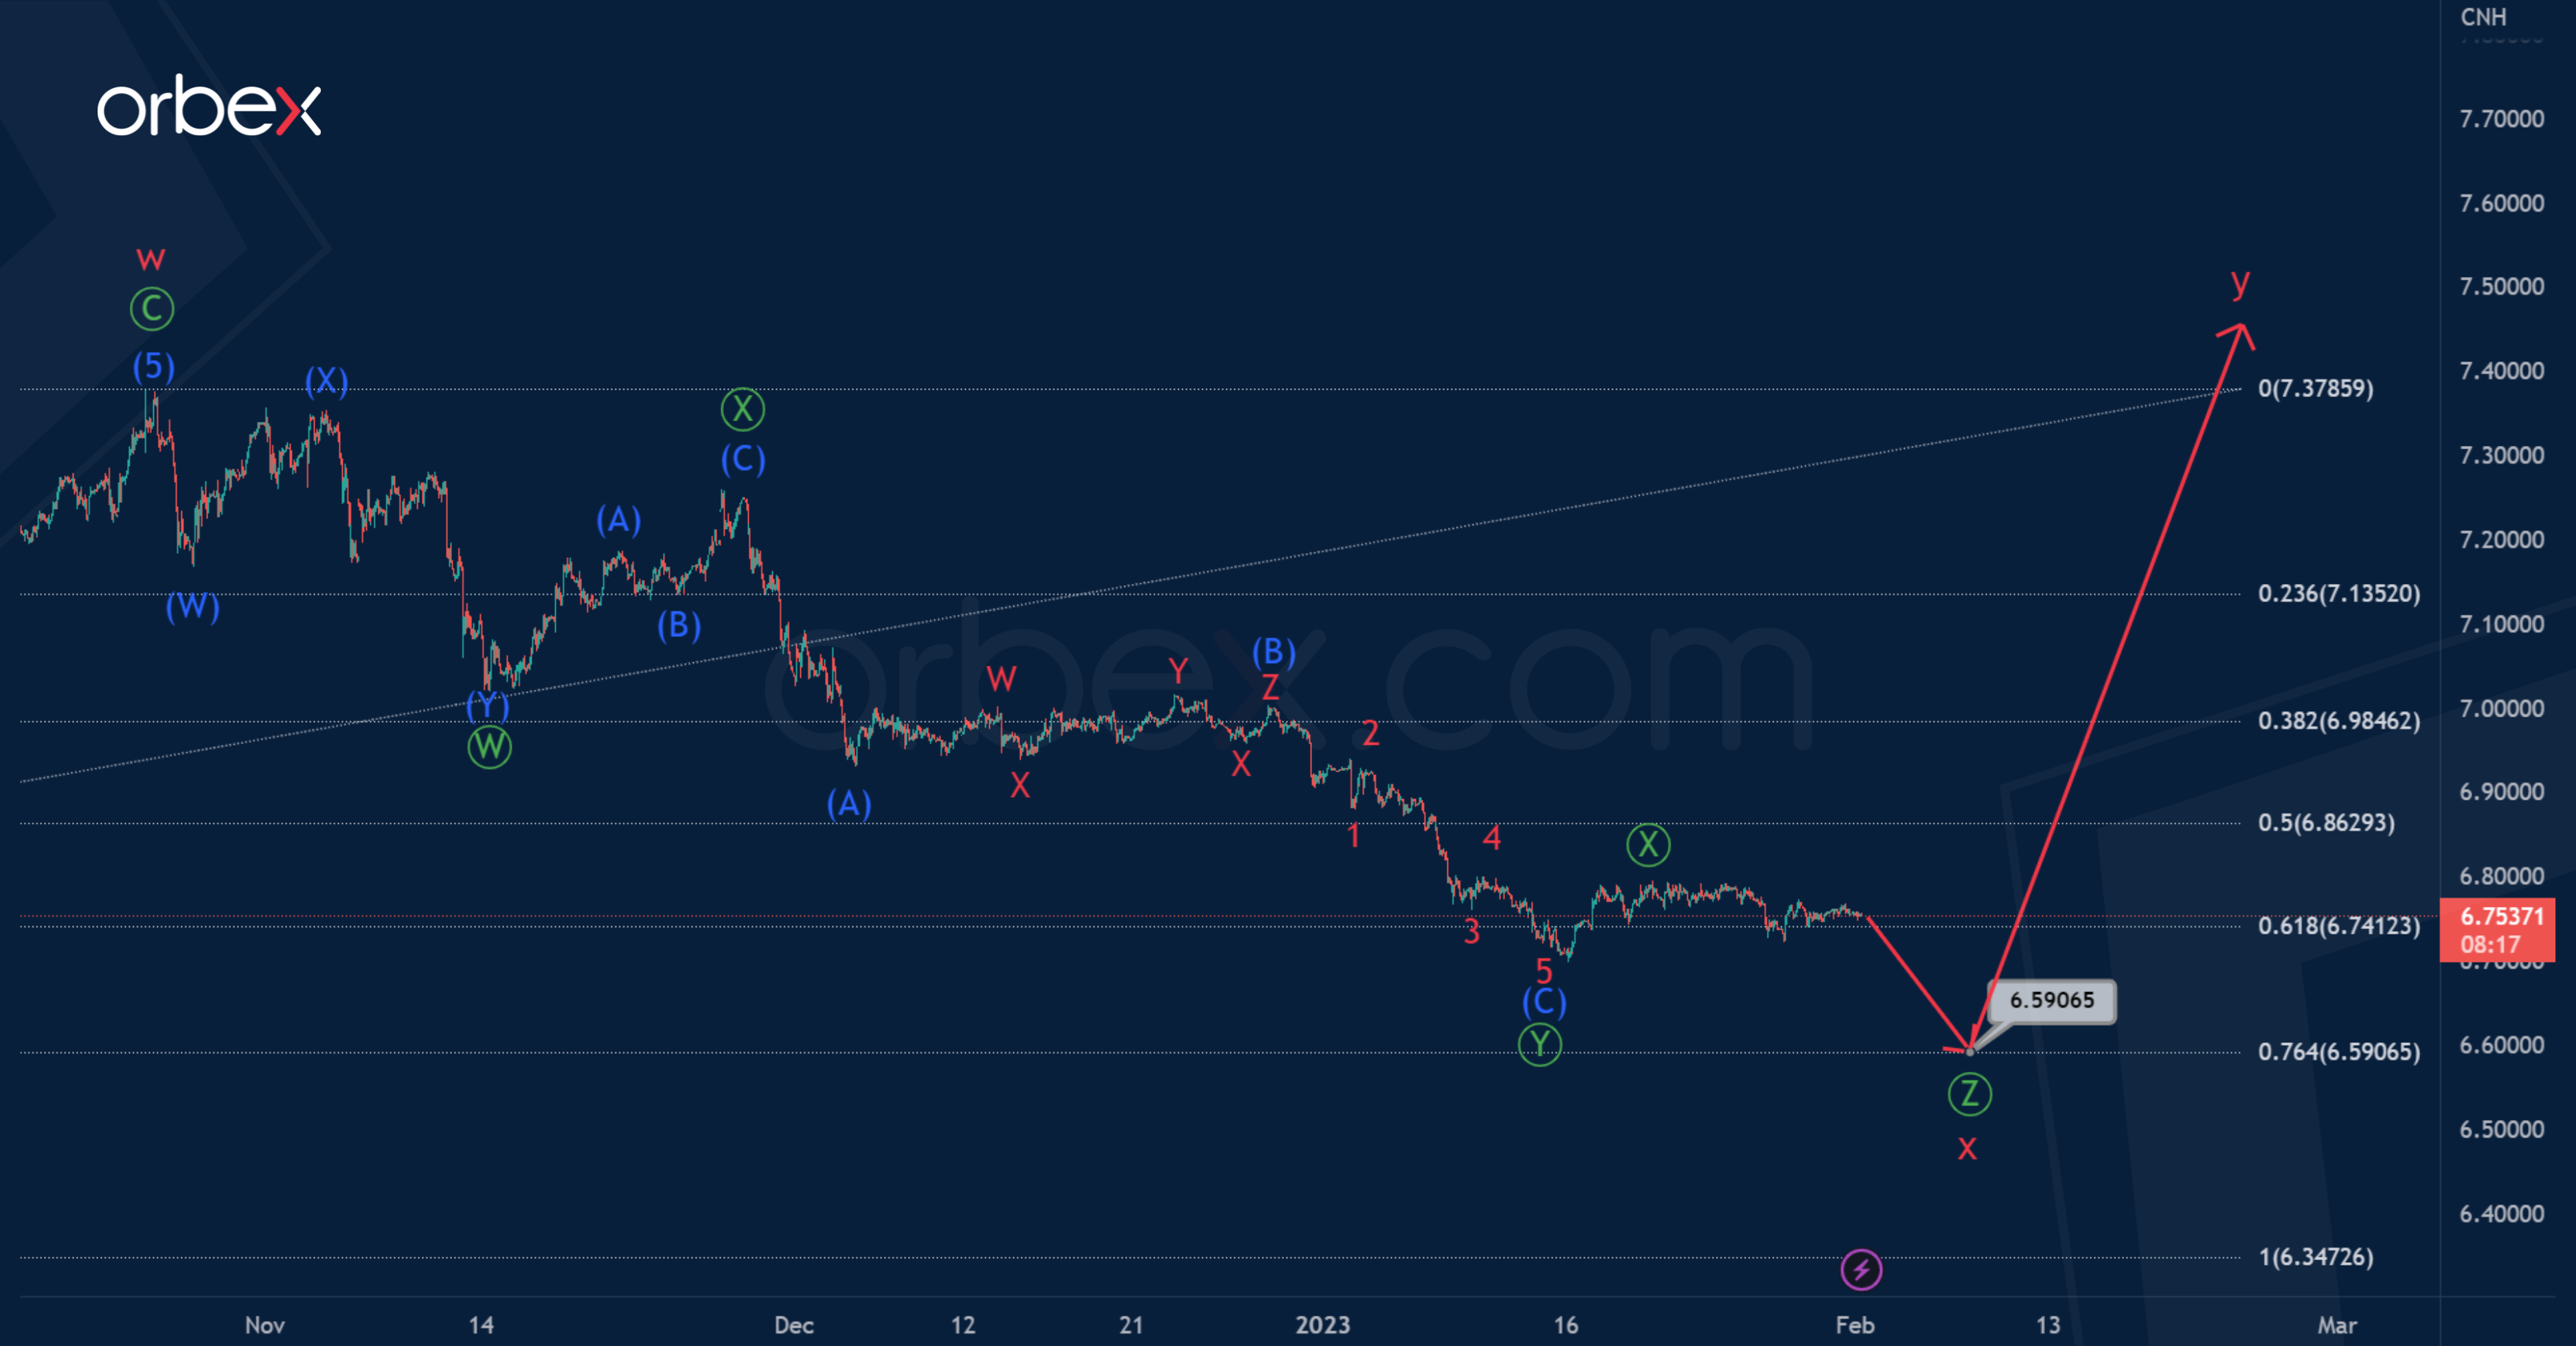
In the second scenario, the price could move in a downtrend. The cycle intervening wave x is not yet complete. Most likely, it will take the form of a triple zigzag Ⓦ-Ⓧ-Ⓨ-Ⓧ-Ⓩ and not a double.
If the actionary wave Ⓨ ends, then a slight increase in the second intervening wave Ⓧ is likely. After which the fall can be continued in the final primary wave Ⓩ.
The approximate level of market decline is 6.590. It is defined using Fibonacci lines. At that level, wave x will be at 76.4% of wave w