

Weekly Gold technical and fundamental outlook:
- ETF inflows see’s a record increase
- Commercial position continues to add to net long positions (273k contracts)
- Brexit worry remains a key factor
- Markets, a bit complacent on Fed rate hike plans
- Weak long positions at/above $1350 at risk of a pullback
- $1300 could be the new floor
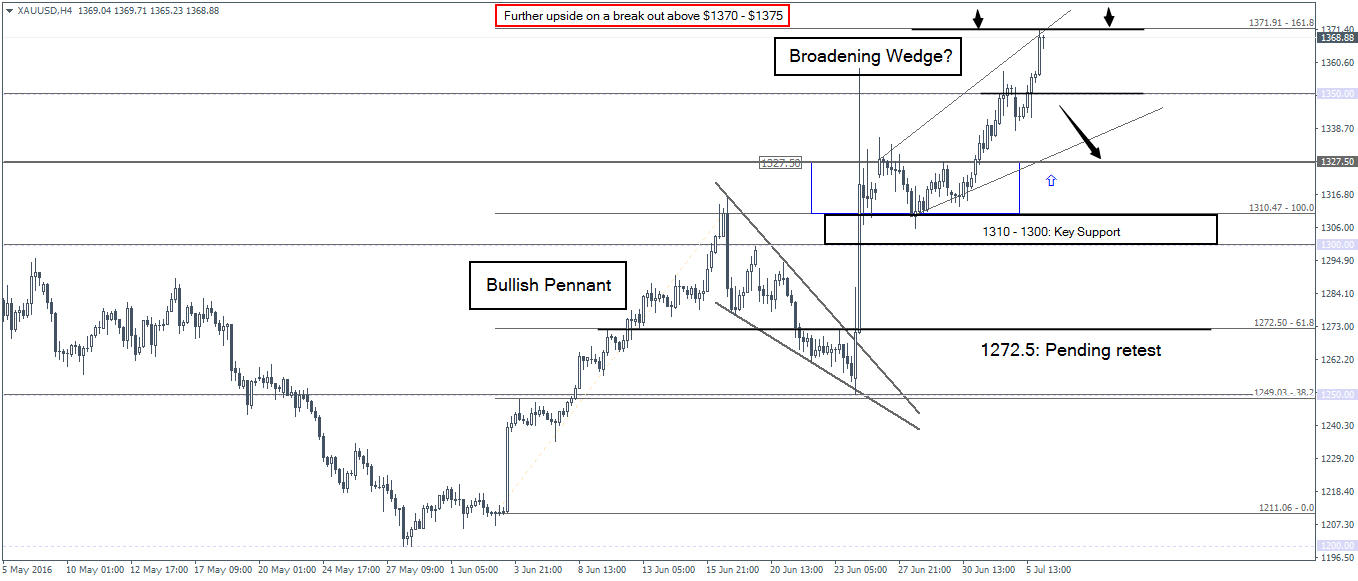
- H4 chart completes bullish pennant measured move ($1371.91)
Renewed Brexit fears intensified selling of risk assets yesterday which saw investors continue to see gold as a safe haven. Spot gold prices jumped overnight, rising above $1350 an ounce and remained well bid with Asian trading today seeing gold testing highs of $1371.38. $1391.97 remains the 2014 high.
The rush to the precious metal also saw gold backed ETF’s such as the SPDR Gold Trust, rising with weekly inflows into ETF’s rising by 6.6 tons to 1,959.1 tons on Friday, July 1st close. It was the highest levels since August 2013. On a year to date basis, the GLD ETF gained more than $12 billion in assets with weekly in flow seen at $1.4 billion. This was followed by inflows into high-yield bond ETF as well.

On the commercial positioning, money managers continued to add to long positions in Gold. Following the brief liquidation around June 3, 2016, commercial money started pouring in steadily, pushing net long positions to a 5-year high (JPY and CHF being other safe havens that also saw a commercial long position build up).
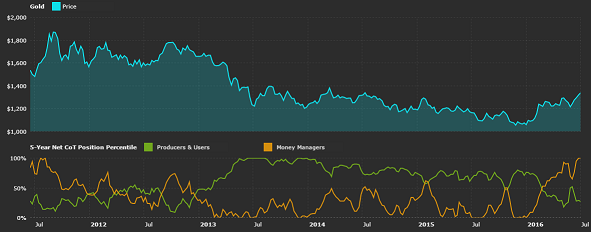
Speculative long positions increased by 18,028 contracts for the week ending June 28th while short contracts also increased over 1,700 contracts
While Brexit worries remain an issue, which also saw investors rush into the safe haven of bonds, the Fed’s rate hike probability also continued to fall keeping the flight to safety trade well oiled. US Treasury bond prices gained, pushing the 10-year yield to all-time lows of 1.36%.
Credit Suisse commodity analysts said that while the markets currently believe that gold has benefitted from the Brexit risks, it could, however, translate into something more enduring than what it seems currently. The Bank of England yesterday announced that it was cutting the bank’s capital buffer requirements to zero percent effective immediately. This has made way for nearly £150 billion in additional liquidity aimed to boost household and business lending. Many expect the BoE to sooner or later start its asset purchase program, which could remain another positive for the precious metal.
Gold – Technical Outlook
The monthly chart for gold shows the uptrend in place. While previously there were expectations of a pullback to the 1180 – 1190 levels, the bullish continuation has invalidated any pullbacks. With prices clearing the $1300 level, any dips are likely to be limited to this level. In the longer term (3 – 6 months outlook), gold prices are likely to continue pushing higher towards the initial level of $1400 and eventually to $1500, which served as a support level in 2011 before giving up in 2013, April. A retest to establish resistance to $1500, therefore, cannot be ruled out.

On the daily chart, the current bearish divergence that is forming could potentially risk a pullback towards the $1300 level unless prices firmly establish support at $1350.

And finally, the 4-hour chart which shows the short-term price action.
Short-term fundamentals that could influence gold prices
- FOMC meeting minutes are due for release later this evening. The minutes cover the June policy meeting where the Fed left interest rates unchanged. Markets speculate that the Fed could put rate hikes on hold amid global uncertainty, which could be supportive of gold. The alternate argument being that the Fed’s mandate of full employment and inflation target will be the only two factors determining the outcome of interest rates.
- Friday’s Payrolls report is expected to show that the US economy added on average 180k jobs in June with the unemployment rate forecast to rise to 4.80%. Revisions to previous reports will also gain attention. A beat on the estimates and more importantly wage growth could bring back the bullish bets on the table